使用自定义配置文件启动php-fpm及使用xdebug+phpstorm进行性能分析
- 2019-04-18 23:49:00
- CJL 原创
- 10490
目的:通过多份配置文件达到不同用户使用不同配置文件
1、复制一份原有php.ini和php-fpm.conf 配置文件到用户目录
2、修改php-fpm.conf内关键参数
[global]
pid = /home/users/***/run/php-fpm-c.pid
emergency_restart_threshold = 10
emergency_restart_interval = 60s
error_log = /home/users/***/logs/php71/php-fpm.log
[www]
user = www
group = www
listen = 127.0.0.1:9102
listen.allowed_clients = 127.0.0.1
pm = static
pm.max_children = 20
pm.max_requests = 500
access.log = /home/users/***/logs/php71/$pool.access.log
access.format = "%R - %u %t \"%m %r%Q%q\" %s %f %{mili}d %{kilo}M %C%%"
slowlog = /home/users/***/logs/php71/$pool.log.slow
request_slowlog_timeout = 5s
将 pid、error_log、listen、access.log、slowlog参数修改为用户目录和自定义端口
3、检查php-fpm配置
/usr/local/***/php71/sbin/php-fpm -c /home/users/***/etc/php71/php.ini -y /home/users/***/etc/php71/php-fpm.conf -t
返回success则可以尝试启动
4、启动php-fpm
/usr/local/***/php71/sbin/php-fpm -c /home/users/***/etc/php71/php.ini -y /home/users/***/etc/php71/php-fpm.conf
5、修改nginx配置文件
fastcgi_pass 127.0.0.1:9102;
修改为用户配置文件内的端口
6、重启nginx
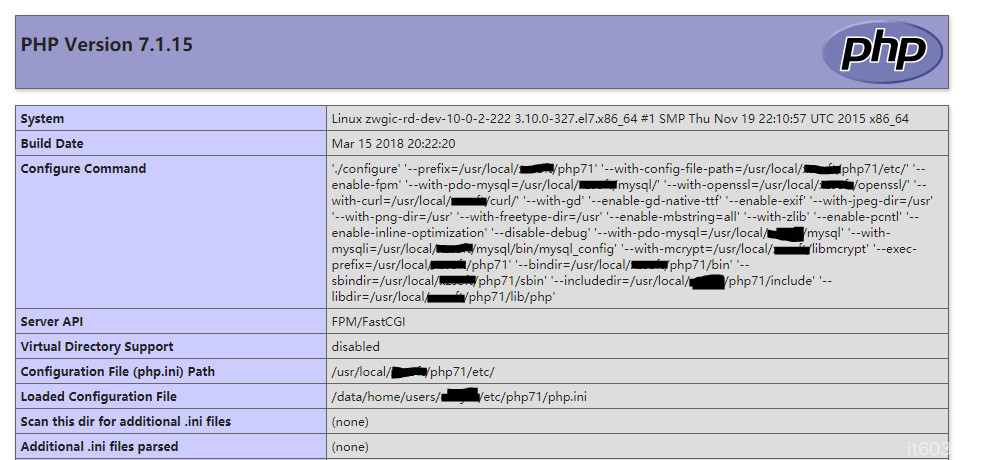
7、访问phpinfo()
可以看到php.ini文件已变成用户目录下的文件
8、后续就可以修改用户目录的配置文件,重启phpfpm后使用了
参考文章:https://www.cnblogs.com/mingaixin/p/3794227.html
9、查看性能分析文件
修改php.ini 打开xdebug
[XDebug]
xdebug.profiler_append = 0
;效能监测的设置开关
xdebug.profiler_enable = 1
xdebug.profiler_enable_trigger = 0
;profiler_enable设置为1的时候,效能监测信息写入文件所在的目录
xdebug.profiler_output_dir="/home/tmp"
;设置的函数调用监测信息的输出路径
xdebug.trace_output_dir="/home/tmp"
;生成的效能监测文件的名字
xdebug.profiler_output_name ="cache.out.%t-%s"
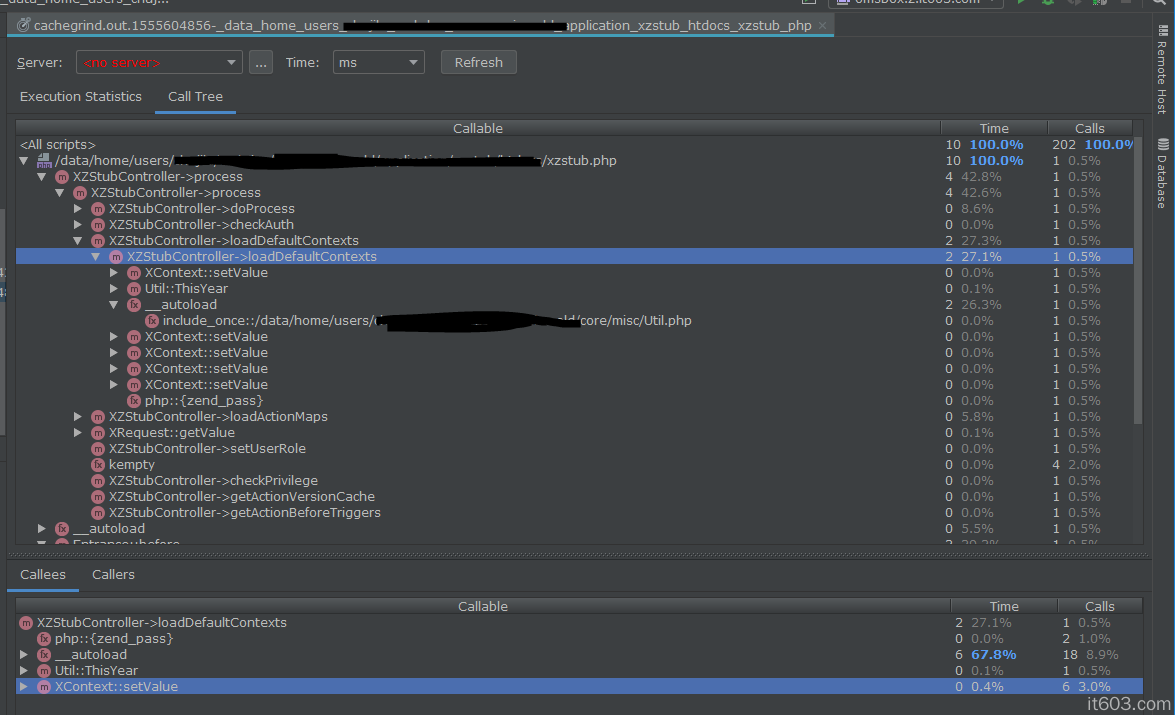
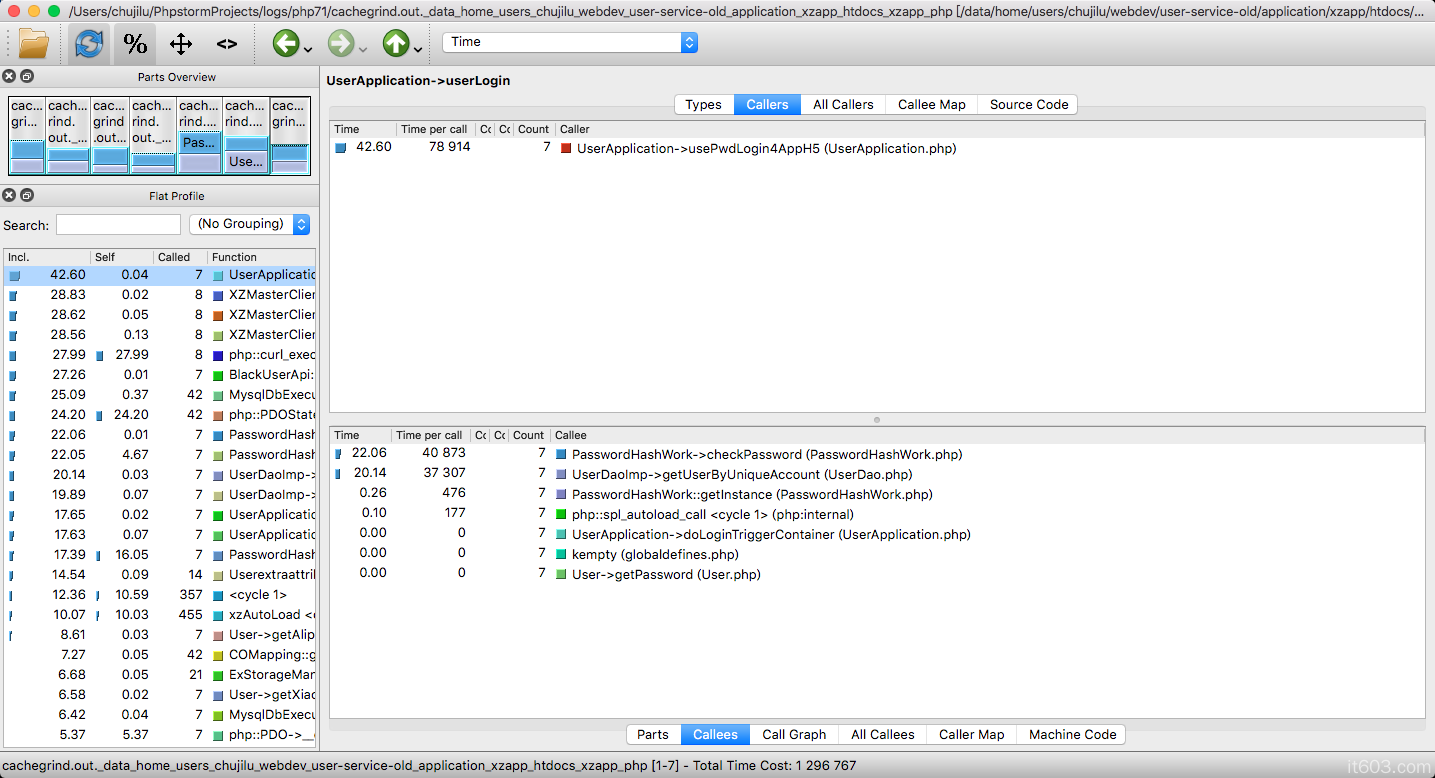
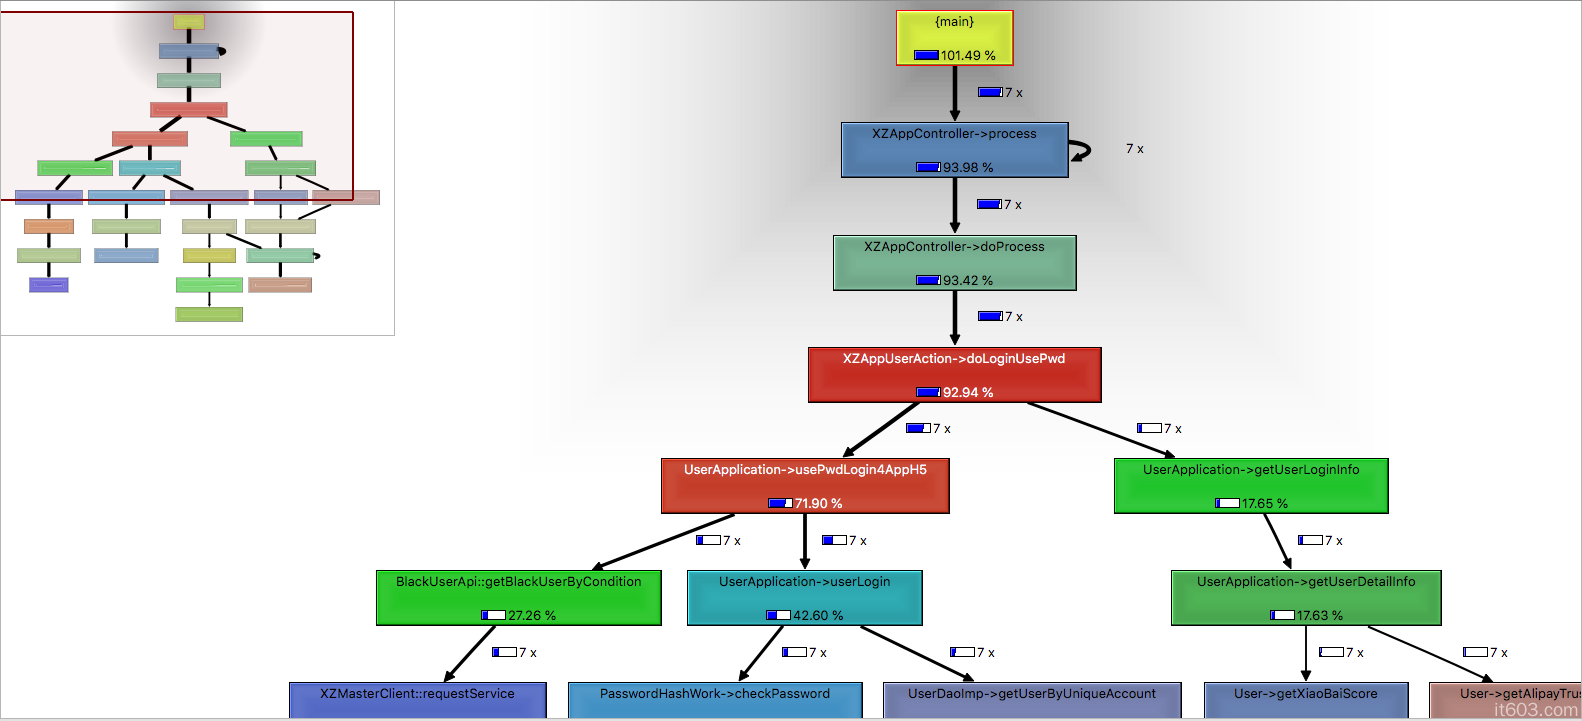
查看profiler_output_dir目录下生成的文件cachegrind.out.*
使用phpstorm打开文件tools->Analyze Xdebug Profiler Snapshot.选中文件查看
参考:https://www.jetbrains.com/help/phpstorm/analyzing-xdebug-profiling-data.html
其他查看分析文件的工具参考:qcachegrind http://yzone.net/blog/151
使用文档 http://kcachegrind.github.io/html/Home.html


发表评论